BAD MAP!

Map generated July 4, 2009.
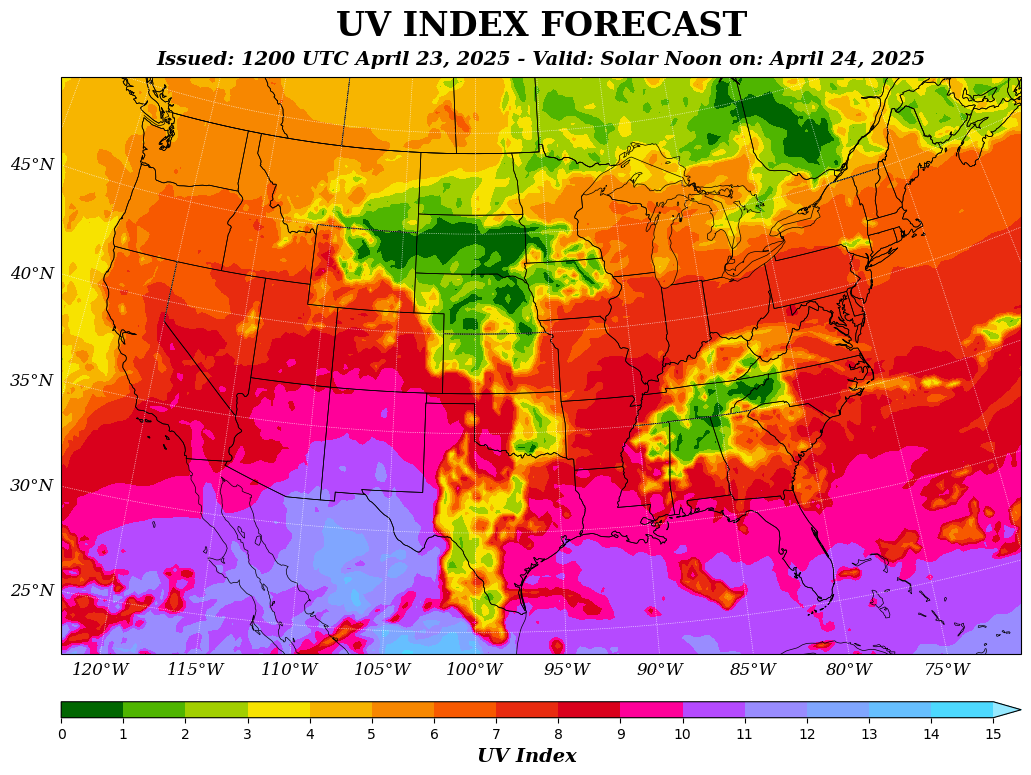
http://www.cpc.ncep.noaa.gov/products/stratosphere/uv_index/gif_files/uvi_usa_f1_wmo.gif will give you a map for today.
The UV index is an international standard measurement of the strength of ultraviolet (UV) radiation from the sun, used as a forecasting tool for the public to help protect against UV overexposure. The index is an open-ended linear scale, with an index of 10 corresponding to midday sun on a clear-sky day. Higher index values represent a higher risk of skin damage from UV exposure.
GOOD MAP!

Aside from the typo (Ethiopia), I like this map. The proportional symbols for major ports and trade routes are simple (even if Singapore is a little distracting) and give just the right amount of geographical information. The expanding range of pirate attacks shown in gradational bands by year captures the chronology of data.
No comments:
Post a Comment